At the end of 2016, my employment at Wick’s Wheels Scooters in Bloomington, IN came to an end when the shop closed the doors permanently. While a sad occasion for myself and the Scooter community, it signaled an impetus to increase the Job Search for me.
I’m an Educator by trade, and I’ve found numbers related to a variety of topics very interesting – grades for students over time (or based on different types of projects/instructional approaches) in schools, or the frequency of required service by scooter models, so it may come as no surprise that I have turned some of my analytical mind towards what I have been concentrating on since Jan. 1, 2017: the Job Search.
Before looking at the numbers, it is important to say that I have been looking for a while. While working at the scooter shop, I was encouraged to explore potential full-time employment. During my tenure at Wick’s I applied to several positions, had an interview or two, but ended up not receiving an offer. The search increased exponentially as word came down of the shop’s imminent closure. The data I have stems from Dec. 21 until now (and the posted charts and data should auto-update as I add more applications).
Unemployment in Indiana
According to the State of Indiana Website, the current Unemployment rate is 4.0% (the national rate is 4.7%) as of this writing. Monroe County, where I reside, ranks 39th in the state with an unemployment rate of 3.8% (note: this document ranks high-to-low, and thus ranks Monroe County as 53rd. For the sake of analysis, I have inverted this to rank low-to-high unemployment rates.)
The state of Indiana allows for an individual to collect up to 26 weeks of unemployment insurance provided they meet certain criteria (pages 6-9). Individuals typically receive around 40% of what their employed income was before taxes over the last calendar year, with a weekly maximum benefit of $390. (For those curious, no, I do not receive nearly that.) At this juncture, I’d like to point out that unemployment benefits are treated as taxable income. As such, income taxes at the Federal, State, and Local levels are withdrawn from the awarded weekly benefit.
In order to collect their weekly unemployment benefit, claimants are required to:
- Submit Weekly Logs of their Job Search to the Claimant Self Service Website when the file
- Submit biweekly logs to their local WorkOne office
- Attend a RESEA (Reemployment Services and Eligibility Assessments) Orientation Workshop at their local WorkOne office
- Attend a minimum of 1 workshop at their local WorkOne Office
- Meet as required with their RESEA Coach as required
It should be noted that the weekly logs only have to have one job applied to, and only offers three spots to report applications to. This can make it difficult to accurately report applications, as more than 3 may go out in a week (for instance – the week of 2/20/2017 – 2/26/2017, I submitted a total of 21 applications as they became available). It is also suggested that claimants retain a log and evidence of their applications in case of audit. My own log is where I am drawing my data from.
Data Collection
In order to log my job applications, I have been using Google Spreadsheets. I have chosen this application as it is part of the larger technological ecosystem I have been using for the job application process – my personal email address (bryrhoey@gmail.com) is used for correspondence and application accounts (with a folder/label dedicated solely to Job Search related materials); Google Drive used to create and store my Resume and Cover Letters, as well as any other application materials required.
As positions are applied to, key information is logged:
- Date Applied
- Institution/Company Name
- Company City/State/Region (as described by the US Census Bureau)
- Job Posting Number (if applicable)
- Job Title
- Sector (Private Co., Government, Public Uni, Private Uni, Public K12, Private K12, Non-Profit, Other)
- Job Status (No Response, In Process, Rejection, Offer, Interview)
- Job Posting Source
Some information is then coded for ease of use in formula for analysis:
Job postings were searched for using the key words of “Instructional Designer” and “Educational Technology Specialist” and include all related postings which show up with these key words.
Data Analysis
Link to Continuously Updated Data Analysis Numbers Page
Link to Continuously Updated Charts Page
8 weeks of data collection (12/21/2016 – 2/25/2016) have yielded some interesting data in regards to locations applied to, response rate, sector, and job source. As the data in the links above is continuously updated as more jobs are applied to, I will use screenshots for the discussion here.
Application Responses
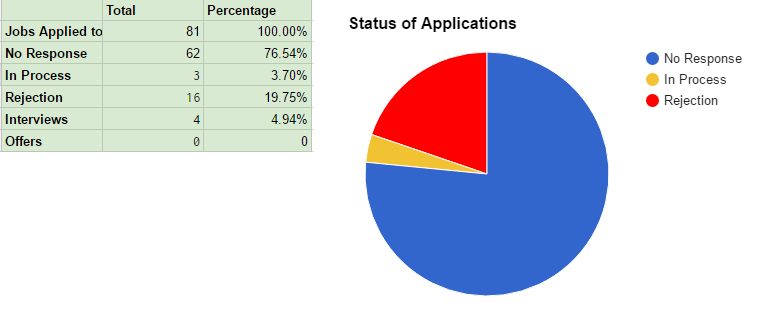
As of 2/25/2017, the Job Application Response rates are as follows:
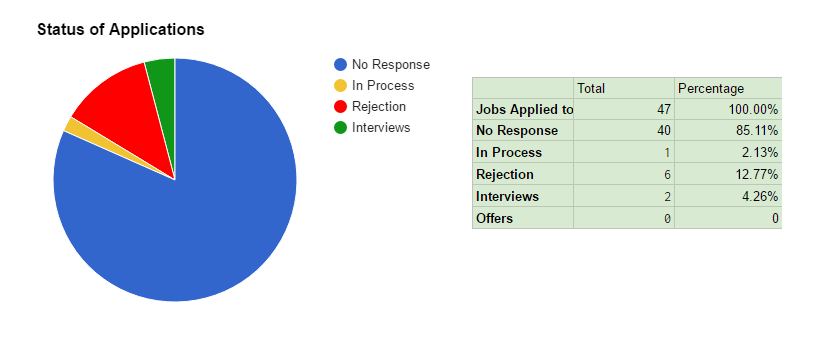
47 jobs applied for, with No Response rate of about 85%. It should be noted that approximately half (21) of these applications were during the current week of 2/20/2017-2/25/2017, and thus should not expect a response this quickly. Not counting the last week of applications, our numbers shift to 26 Applications, with 19 having no responses (or 73%). It should also be noted that Interviews are included in the chart, but may have resulted in a Rejection or In Progress (in this case, 1 Rejection, 1 In Progress). Based on a cursory Google Search, that seems about par for the course when submitting applications.
2/27/2017 edit – I have removed the “Interviews” portion of the pie chart from the continuously updated link to more accurately display the status of applications. You can find the number of interviews on the “Data Analysis Numbers” page linked above.
2/28/2017 edit – For clarification, definitions of the values are as follows:
- Jobs applied to: the total number of applications which have been submitted completely
- No Response: Application has been submitted completely, Company/School has not yet reached out with a response
- In Process: At least the initial screening (usually phone) has been completed, and no decision has been made.
- Rejection: Company/School has informed me my application will not be moved forward
- Interview: I have had at least one interview with a company, either phone or face-to-face
- Offer: Company has made me a job offer
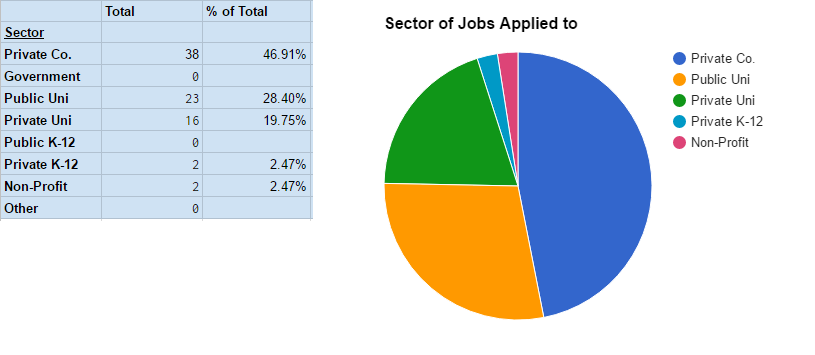
Job Sectors
As of 2/25/2017, the Job Sectors where I have submitted applications are as follows:
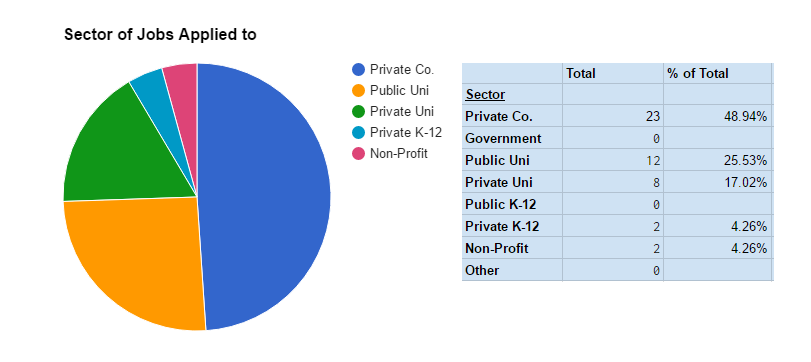
Based on the information, just over half of the positions applied for are located at Privately Held Companies, while Public Universities make over a quarter of the applications. Of note are the 0 Public K-12 positions, which have not come up in any of the job searches. Government applications remain at 0 due to the US Government Hiring Freeze as of January 23, 2017.
A break-down of application responses by sector may be found on the Data Analysis Sheet.
Locations
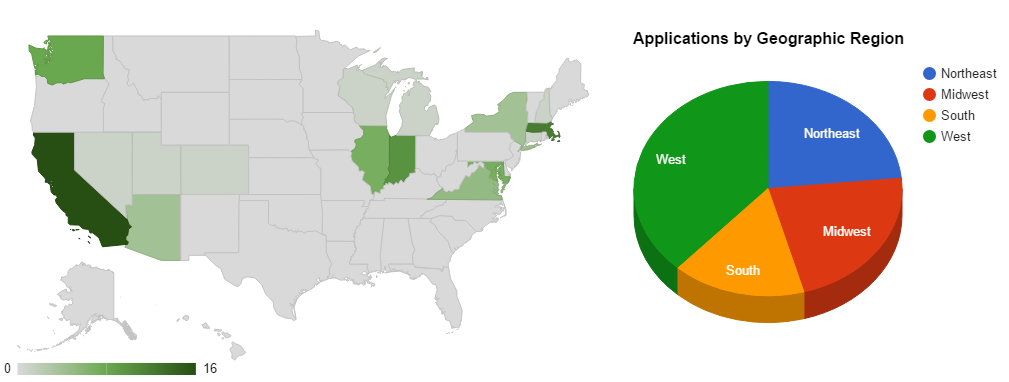
As of 2/25/2017, the locations where I have applied for jobs are as follows:
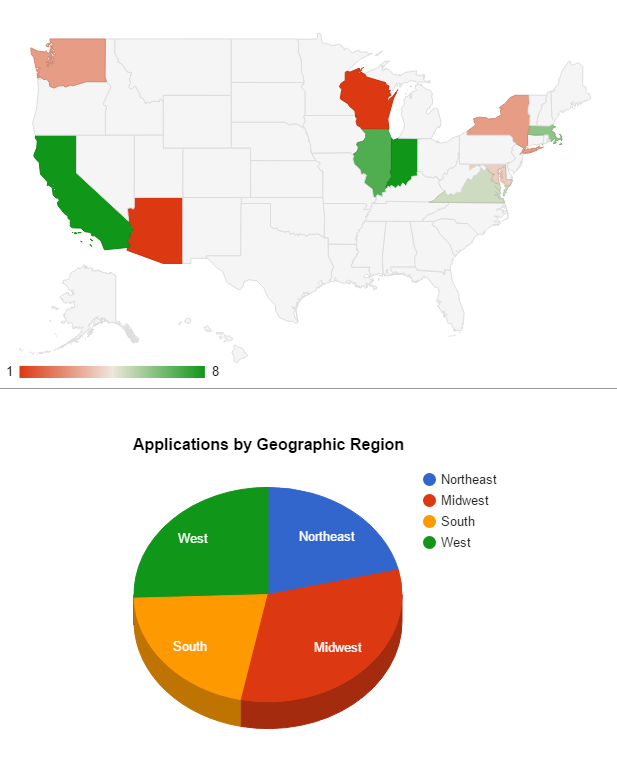
Regions were defined using the US Census Bureau’s definition of US Regions, and are outlined in the above linked “Keys” page. The spread of geographic regions appears to be rather proportional, with all regions receiving at least 21% of applications. The Midwest lists more applications, partially due to an increase of job listings in Chicago, IL., and partially due to my current location in Bloomington, IN.
The States Map shows five main states/regions where applications seem to be concentrated: The DC Metro Area (highlighted by Maryland and Virginia), the Boston Metro Area, Chicago Metro Area, Bloomington, IN, and California (with a majority of the CA applications focusing on the San Francisco Bay Area). These areas were applied to based on a criteria of compatibility of job listings for Instructional Designers/Educational Technology Specialists, Political Ideology, and my own interest in living in the area.
Based on the locations of applications submitted, it becomes apparent that many positions are based in major US cities, or the applicant’s preference is to live in a major US city.
A break-down of application responses by region may be found on the Data Analysis Sheet.
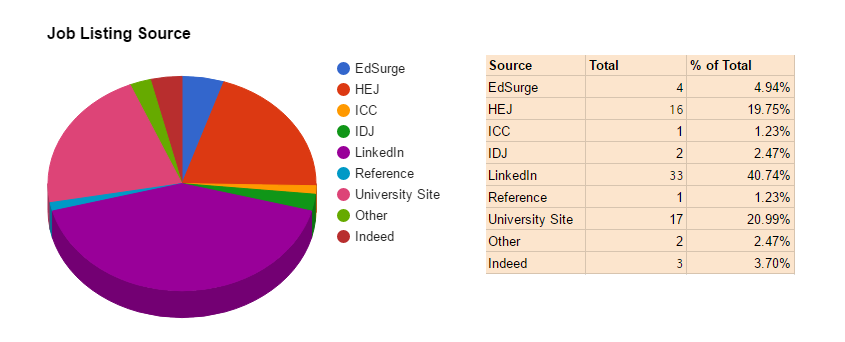
Job Posting Sources
As of 2/25/2017, the sources of the Job Postings are as follows:
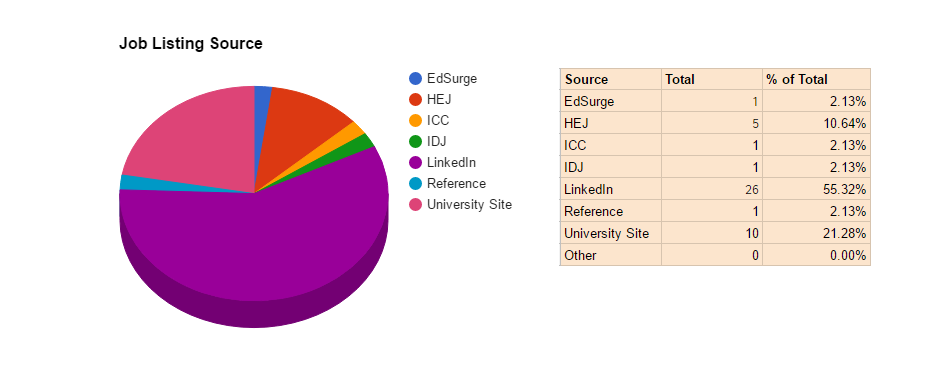
The information shows a variety of sources of job positions which have been applied to. Of note is the 55% of jobs sourced through LinkedIn. This suggests a heavy reliance on one site over others. On deeper exploration, 21 of the 26 LinkedIn positions are for jobs with Private Companies, accounting for 91% of all jobs applied for in Private Companies.
Further exploration of applications, the sectors they are for, and the source of the applications are all planned for the near future.
In regards to response rate and sector, it appears that the Private K-12 sector has the best response rate (50%) but a very small sample size (n=2). Thus, there is not enough information to see a trend. As stated in the general response information portion above, the vast amount of applications have no response.
A break-down of application responses by Sector may be found on the Data Analysis Sheet.
Conclusion
Unemployment is a difficult time for many people. A loss of income, a break with routine, and many potential hazards for mental and physical well being and future opportunities. As with any other activity, it is important to look beyond the face-value facts – to seek trends which may bring to light new discoveries, ideas, and approaches.
The point of this exercise in “crunching the numbers” and writing about it was three-fold: (1) to brush up on some rusty skills (such as blogging, spreadsheets, etc.), (2) to actually look at the data, identify trends, and make my own job search stronger, and (3) to be able to step away from job search engines, lists, and e-mails, but remain constructive in the job searching process.
I would like to be able to dig a little deeper in the data as I find time, looking across the variables to find out what the most successful types, places, and sectors for applications may be.
Of course, I am always open to suggestion. Is there some data I have collected you would be interested in examining (or having me examine)? Would you like to volunteer to review my Resume and Cover Letters for editing purposes? Have a job lead you think I should look into? Get in contact with me, and we can see about arranging something.
In the meantime, I will continue to remain determined and hopeful that I will find a suitable position in making a difference, be it at a company, a K-12 school, or a University.
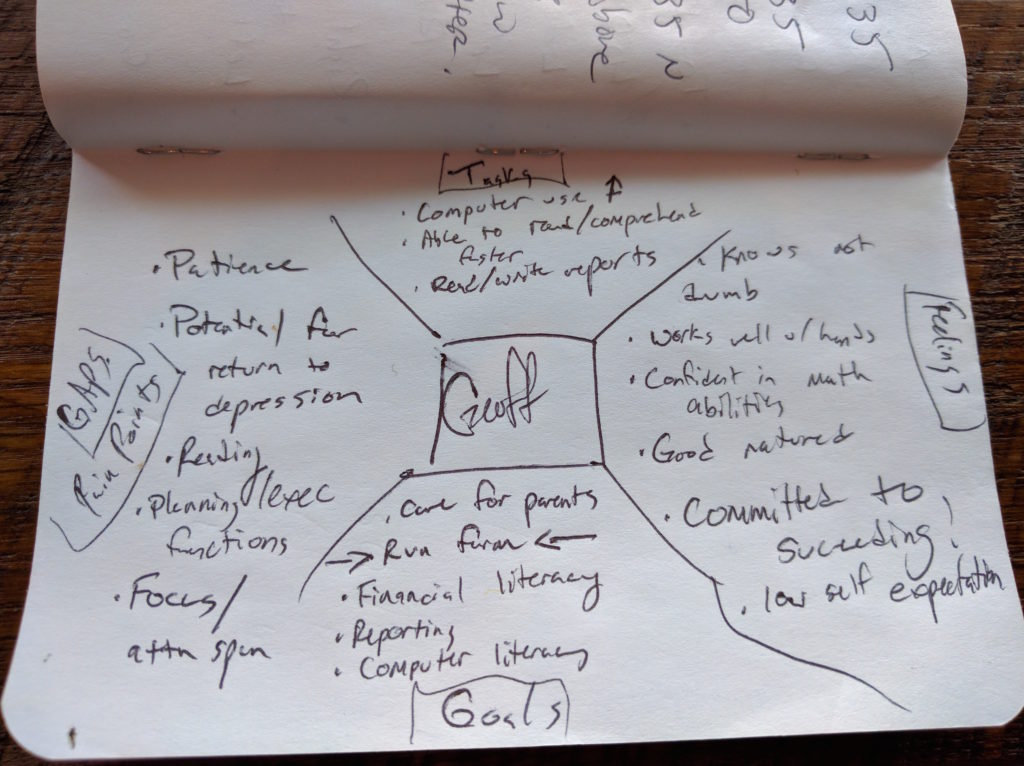 Based on the dossier on Geoff, we can see that he wants to succeed – but he has reservations on his own ability. A major portion of the design for Geoff will focus on appropriate materials – he needs materials which will not seem condescending (not geared for children), help him with executive function tasks, and above all, allow for patience and understanding.