The close of this week brings to an end the 11th week of my job search since the beginning of the year. In retrospect, I may be incorrect on precisely how many weeks it’s been, so I am just going to go based off my last post about the job search.
Don’t worry, this post will be a lot less academically written, but still chock-full of pictures of graphs and numbers!
I am still using the same method and process as described in my previous post.
Data Analysis
Link to Constantly Updated Data Analysis Tab
Link to Constantly Updated Charts Tab
Application Responses
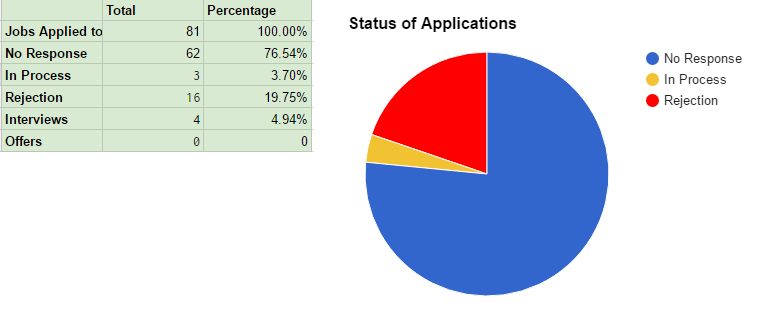
As of 3/17/2017, the Application Response Rates are as follows:
In it, we can see a contrast as compared to February 25’s post:
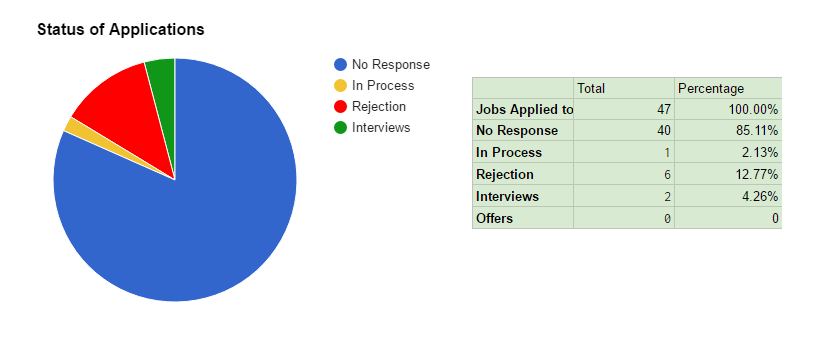
Since 2/25/2017, I have applied to 34 jobs. The additional weeks have also allowed institutions to respond to applications as well. Of note, we see a decrease in the percentage of No Responses (from 85% to roughly 77%). This can be seen in an increase of rejection notices (from 6 to 16), and In-Process (no decisions made as of yet – from 1 to 3).
As discussed in the previous post, I have removed the “Interviews” slice of the pie chart, as these are already counted in the “In Process” or “Rejection” slices.
As reported in the last post, I will also look at applications without the current week’s applications (which numbers 8 applications). In doing this, the number of applications submitted is 73. Of these, 54 (74%) have no responses, with rejections (22%) and interviews (5%) changing as noted.
A break-down of application responses may be found on the Data Analysis Sheet.
Job Sectors
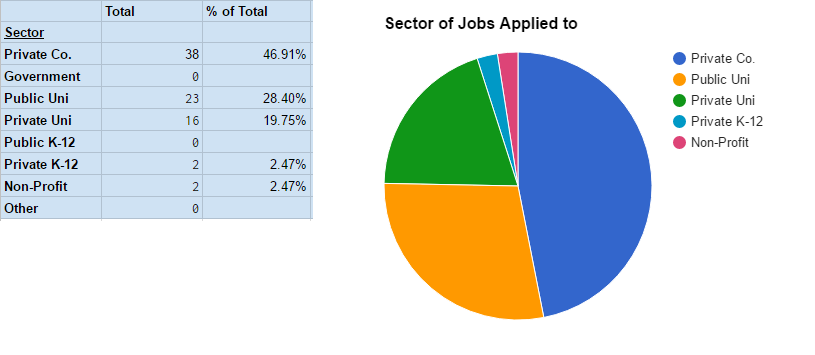
As of 3/17/2017, the Job Sectors where I have submitted applications are as follows:
Compare to 2/25/2017:
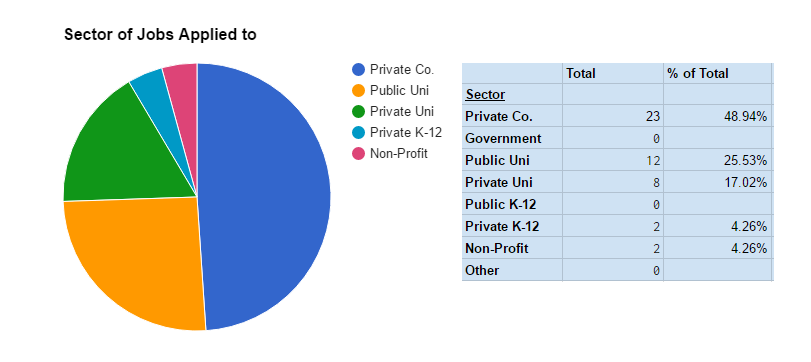
In comparing the two dates, we see a similar trend, with a slight change towards public universities. Overall, percentages per sector remain similar. Government applications remain at 0 due to the US Government Hiring Freeze as of January 23, 2017.
A break-down of application responses by sector may be found on the Data Analysis Sheet.
Locations
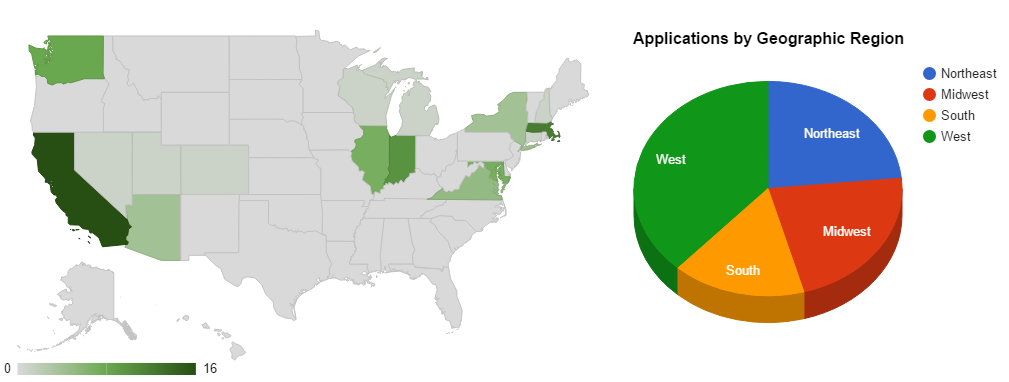
As of 3/17/2017, the locations where I have applied for jobs are as follows:
Compared to 2/25/2017:
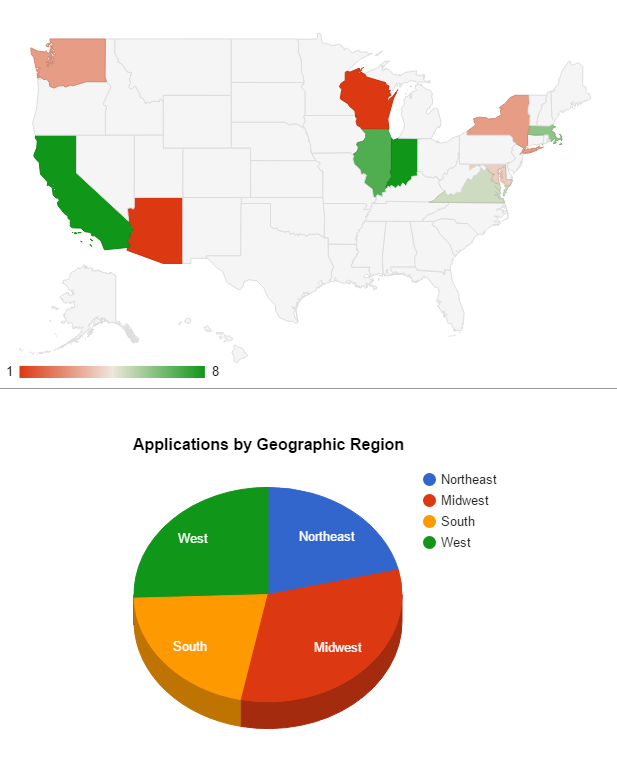
The information on this section has been changed a little to make the displaying of data more intuitive. 2/25/2017’s map had a variety of colors, showing red as 1 application, and green as many. I have opted to move to a light green -> darker green scale to better showcase the actual applications for geographic region.
Over the last three weeks, positions have been posted with a skew towards the west, which now accounts for 38% of all applications. Applications in the Midwest and South have decreased in general, with applications stemming from the “South” still only being focused on in the DC area. No other states in the southern US have locations with applications.
In terms of state distribution, there are still concentrations in the DC area (though less in this round of analysis compared to the previous examination), Boston, and San Francisco Bay Area. California remains at the top of the application list, now with 16 total applications. The DC area accounts for 12, as does the Boston-metro area.
A break-down of application responses by region may be found on the Data Analysis Sheet.
Job Listing Sources
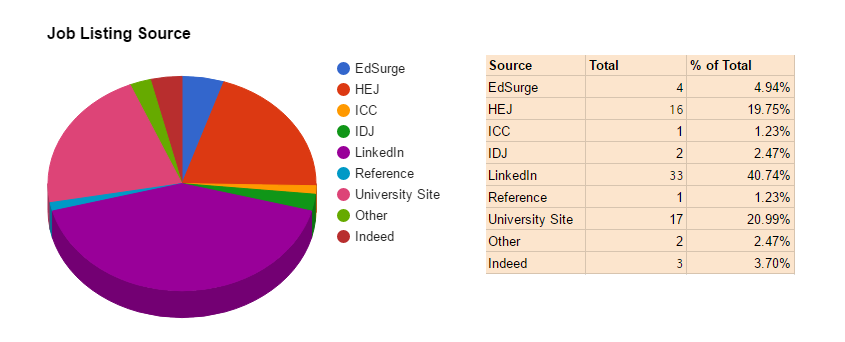
As of 3/17/2017, the sources of job postings applied to are as follows:
Compared to 2/25/2017’s post:
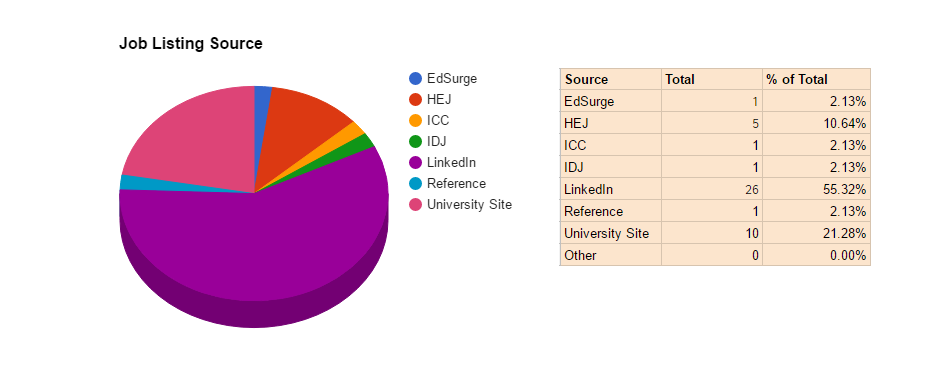
In examining the sourcing of job postings that have been applied to, we see a little more variety across the board. This indicates less of a reliance on LinkedIn (which previously accounted for 55% of all jobs applied to, now at 41%). HigherEdJobs.com sees a significant boost as a source of applications, rising from 11% to nearly 20% of total applications.
It is also interesting to note that there is not a lot of overlap between the above listed websites. University sites will have jobs listed, and may not be listed on other sites. Of note are some HigherEdJobs postings mirroring those on a University site, or those on LinkedIn. However, there have been few posted to HigherEdJobs and IDJ, EdSurge, etc. However, I have not been collecting data on postings which have multiple sources, instead only indicating the first place I had seen/applied from.
A break-down of application responses by source may be found on the Data Analysis Sheet.
Conclusion
I should note in this section a few items. In between the two postings, I have had two additional interviews (one with a private university in the West region, which was performed via Skype, the other in person at a Land-Grant Public University). I have also taken a job at a newly-opened local coffee shop, helping build the business, train staff, and create training materials.
Responses have begun to come in, which is helpful, regardless of if they are for an interview, or an outright rejection – it helps focus the search and move on to more applications.
The fact that I am working again does mean there is less time to search and apply – however, I continue to dedicate my time and energy to finding a full-time Instructional Design job.